How to Connect Ubiquiti Dream Machine to LogMan.io to Collect and Monitor NetFlows
A Ubiquiti UniFi Dream Machine (UDM) is a popular choice for small and mid-sized networks. It handles routing, switching, and Wi-Fi from a single appliance — but by default, it is something of a black box for your SIEM. Its NetFlow/IPFIX export is an excellent way to lift the hood: every conversation that crosses the gateway can be analyzed, searched, and correlated inside TeskaLabs LogMan.io.
This guide walks through the full path, from enabling NetFlow export on the UDM to monitoring the collected flow records in LogMan.io. The setup described here is the exact configuration we run in production at TeskaLabs on our own office router, so every step below is verified to work.
Why NetFlow? What do you gain over plain logs?
The UDM can already ship firewall and system events over syslog. NetFlow is different: instead of discrete events, it gives you aggregated flow records describing every connection that traverses the gateway:
- Who talked to whom — source and destination IP addresses and ports
- How much — packets and bytes transferred in each direction
- For how long — flow start and end timestamps
- What protocol — TCP, UDP, ICMP, and so on
With flows in your SIEM you can answer questions that plain syslog cannot:
- "Which internal host is talking to that suspicious external IP, and how much data has moved?"
- "What does our normal east-west traffic profile look like — and when did it change?"
- "Is there a host that is beaconing — small, periodic flows to a fixed destination?"
NetFlow is transport-agnostic and encrypted-traffic-friendly: even fully encrypted connections produce flow records, because the metadata of the conversation is visible even when the payload is not. That makes it a cornerstone of network visibility.
Note on protocols
The Dream Machine exports flows in NetFlow v9 / IPFIX over UDP. (IPFIX is standardized as NetFlow version 10, which is how the UniFi UI labels it.) Both variants are handled transparently by the collector described below.
Architecture overview
The UDM speaks NetFlow over UDP, but LogMan.io's Collector consumes the Lumberjack protocol (the same protocol used by Elastic Logstash) over TCP. The clean bridge between the two is Filebeat, whose built-in netflow input acts as a UDP NetFlow/IPFIX collector and re-publishes each decoded flow record as a JSON event.
┌─────────────┐   NetFlow v9 / IPFIX (UDP)   ┌──────────────────┐
│  UniFi UDM  │ ───────────────────────────► │  Filebeat        │
│  (gateway)  │     port 2055/udp            │  netflow input   │
└─────────────┘                              └────────┬─────────┘
                                                      │ Lumberjack (TCP 5044)
                                                      ▼
                                            ┌──────────────────┐
                                            │ LogMan.io        │
                                            │ Collector        │
                                            │ → Receiver       │
                                            │ → Discover, ...  │
                                            └──────────────────┘
- UDM → Filebeat: NetFlow/IPFIX over UDP, standard collector port 2055.
- Filebeat → LogMan.io Collector: Lumberjack over TCP, default port 5044 — the same integration used for any other Beats product (Winlogbeat, Auditbeat, …).
- LogMan.io side: the Collector accepts the Beats connection, and the incoming
streamfield determines the target stream / event lane. No custom connector is needed — Filebeat is a first-class citizen of the LogMan.io Collector.
1. Enable NetFlow export on the Dream Machine
Log in to the UniFi Network application (the web UI of your UDM) and navigate to:
Settings → CyberSecure → Traffic Logging
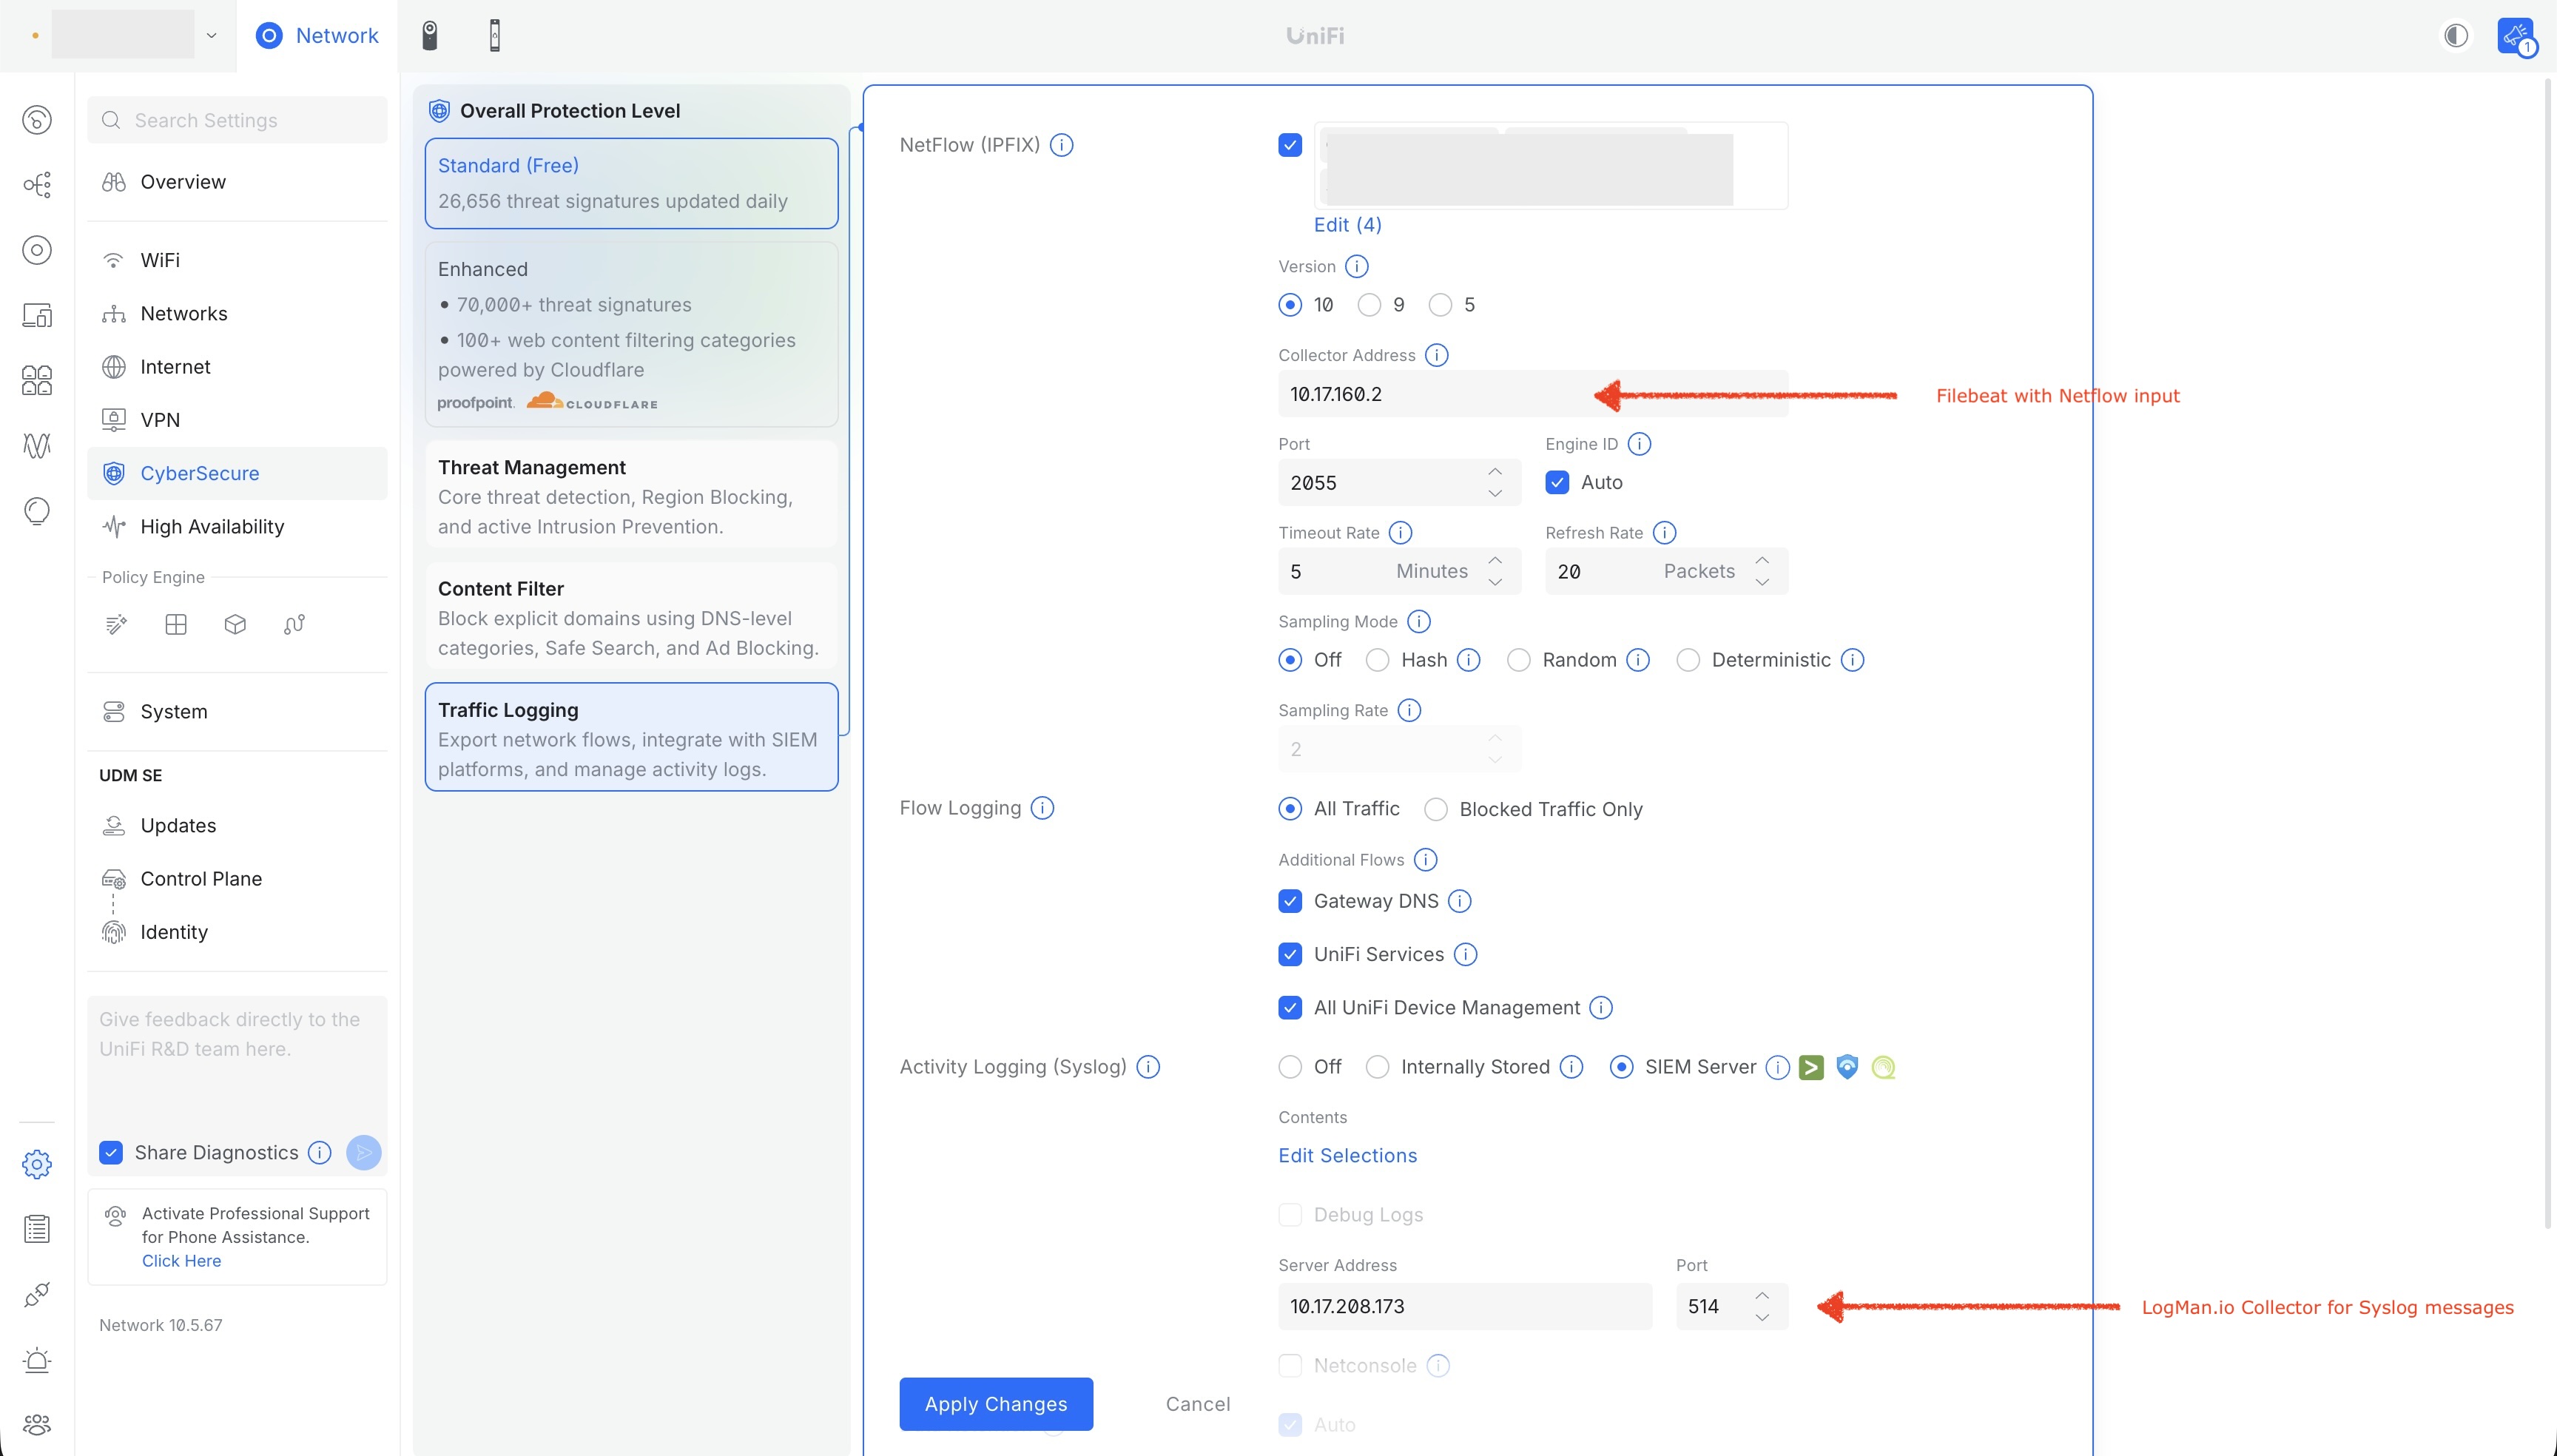
In the NetFlow (IPFIX) section:
- Enable the NetFlow (IPFIX) export and select the networks whose traffic should be exported (we export all of them: office, sandbox, and the default network).
- Keep Version at 10 (IPFIX); the collector below also accepts v9 and v5.
- Set the Collector Address to the host that runs your Filebeat collector (in our case
10.17.160.2). - Set the Port to 2055 (UDP) and leave Engine ID on Auto.
- Leave Sampling Mode set to Off, so every flow is exported — at office scale there is no need to sample.
- Under Flow Logging, select All Traffic (not just blocked traffic), and optionally enable the additional flows: Gateway DNS, UniFi Services, and All UniFi Device Management.
- Apply the changes.
The defaults for Timeout Rate (5 minutes) and Refresh Rate (20 packets) work well; they control how often long-lived flows are re-reported and how often templates are re-sent.
Tip
On the same screen, Activity Logging (Syslog) can point the UDM's regular event logs at a SIEM server. That is a separate, complementary feed — this article focuses on the NetFlow export.
The UDM should immediately start sending UDP datagrams to the collector address. You can verify from the collector host with:
$ sudo tcpdump -i any -c 20 udp port 2055
09:39:53.375526 lan0  In  IP 10.17.160.1.56014 > 10.17.160.2.2055: UDP, length 1392
09:39:54.055611 lan0  In  IP 10.17.160.1.56014 > 10.17.160.2.2055: UDP, length 1404
...
The source (10.17.160.1) is the UDM gateway itself. Datagrams of roughly 1.4 KB are typical NetFlow v9 / IPFIX packets carrying templates and flow records.
2. Run a Filebeat NetFlow collector
We run Filebeat as a Docker container on a small Linux host inside the office network. Any host reachable from the UDM works; it just needs the netflow input enabled and the UDP port published.
The relevant part of our docker-compose.yml:
  filebeat:
    image: docker.elastic.co/beats/filebeat:9.1.4
    container_name: filebeat
    user: root
    ports:
      - "2055:2055/udp"   # NetFlow/IPFIX collector for UniFi UDM
    volumes:
      - ./filebeat/filebeat.yml:/usr/share/filebeat/filebeat.yml:ro
      - ./filebeat/data:/usr/share/filebeat/data
    restart: unless-stopped
Note on networking
The container runs on Docker's default bridge network, so the UDP port is published with ports:. If you expect very high flow volumes, you can instead run Filebeat with network_mode: host to avoid the userland NAT proxy — at office-scale traffic levels the published port is perfectly fine.
The Filebeat configuration itself (filebeat.yml) adds the NetFlow input:
filebeat.inputs:

  # NetFlow / IPFIX collector for the UniFi Dream Machine
  - type: netflow
    id: netflow-udm
    host: "0.0.0.0:2055"
    protocols: [ v5, v9, ipfix ]
    max_message_size: 10KiB
    expiration_timeout: 30m
    queue_size: 8192
    detect_sequence_reset: true
    fields:
      stream: netflow
A few notes on the options:
protocols: [ v5, v9, ipfix ]— the UDM speaks v9/IPFIX; the other values are harmless and future-proof.expiration_timeout: 30m— how long idle NetFlow sessions/templates are kept before expiring.queue_size: 8192— UDP receive queue depth, to avoid packet loss under bursts.detect_sequence_reset: true— drop stale templates if the UDM restarts and its export sequence numbers reset.- The
fields.stream: netflowblock labels every flow record with astream: netflowfield. As shown below, LogMan.io uses this field to route the records into a dedicated stream, which keeps flow data cleanly separated from your log data.
Apply the configuration by recreating the container:
$ docker compose up -d --force-recreate filebeat
Gotcha
docker compose up -d alone will not pick up changes to a file-mounted config — the running container keeps the old config. Use --force-recreate (or restart) whenever you edit filebeat.yml.
3. Forward the records to LogMan.io
The LogMan.io Collector natively accepts Beats/Logstash connections (Lumberjack protocol) on TCP port 5044. On the collector side there is nothing special to configure — the Beats input is enabled by default:
input:Beats:beats:
  output: beats
output:CommLink:beats: {}
Because the output: beats designation uses the dynamic stream routing, each incoming event is assigned to the stream named by its stream field. Our NetFlow records carry stream: netflow, so they will land in the netflow stream and its associated event lane — no per-source configuration needed.
Point Filebeat at the collector by adding the Logstash output (the same block used for all our other Filebeat inputs):
output.logstash:
  hosts: ["<collector-address>:5044"]
Replace <collector-address> with the hostname or IP of your LogMan.io Collector. If TLS is enabled on the Beats input, add the corresponding ssl section here as described in the Beats, Logstash documentation.
4. Verify the pipeline end-to-end
Once everything is connected, check each hop:
A. Filebeat started the NetFlow input — the log should show:
Starting netflow decoder
Starting udp server
Started listening for UDP connection
...
Loading and starting Inputs completed. Enabled inputs: 30
B. Flows are arriving from the UDM — watch the port:
$ sudo tcpdump -i any udp port 2055
You should see a steady stream of ~1.4 KB datagrams from the UDM's IP.
C. Filebeat is decoding and publishing — the periodic monitoring snapshot in the Filebeat log shows flow events being added, published, and acked:
"events": {"acked": 3927, "active": 0, "batches": 3, "total": 3927}
D. LogMan.io Collector is receiving — in the LogMan.io web UI, the netflow stream should show incoming events within seconds (see next section).
5. Using the data in LogMan.io
Flow records arrive in LogMan.io as structured JSON events. In the Discover section, select the Netflow data source from the dropdown — you can then search and filter the flows just like any other log data:
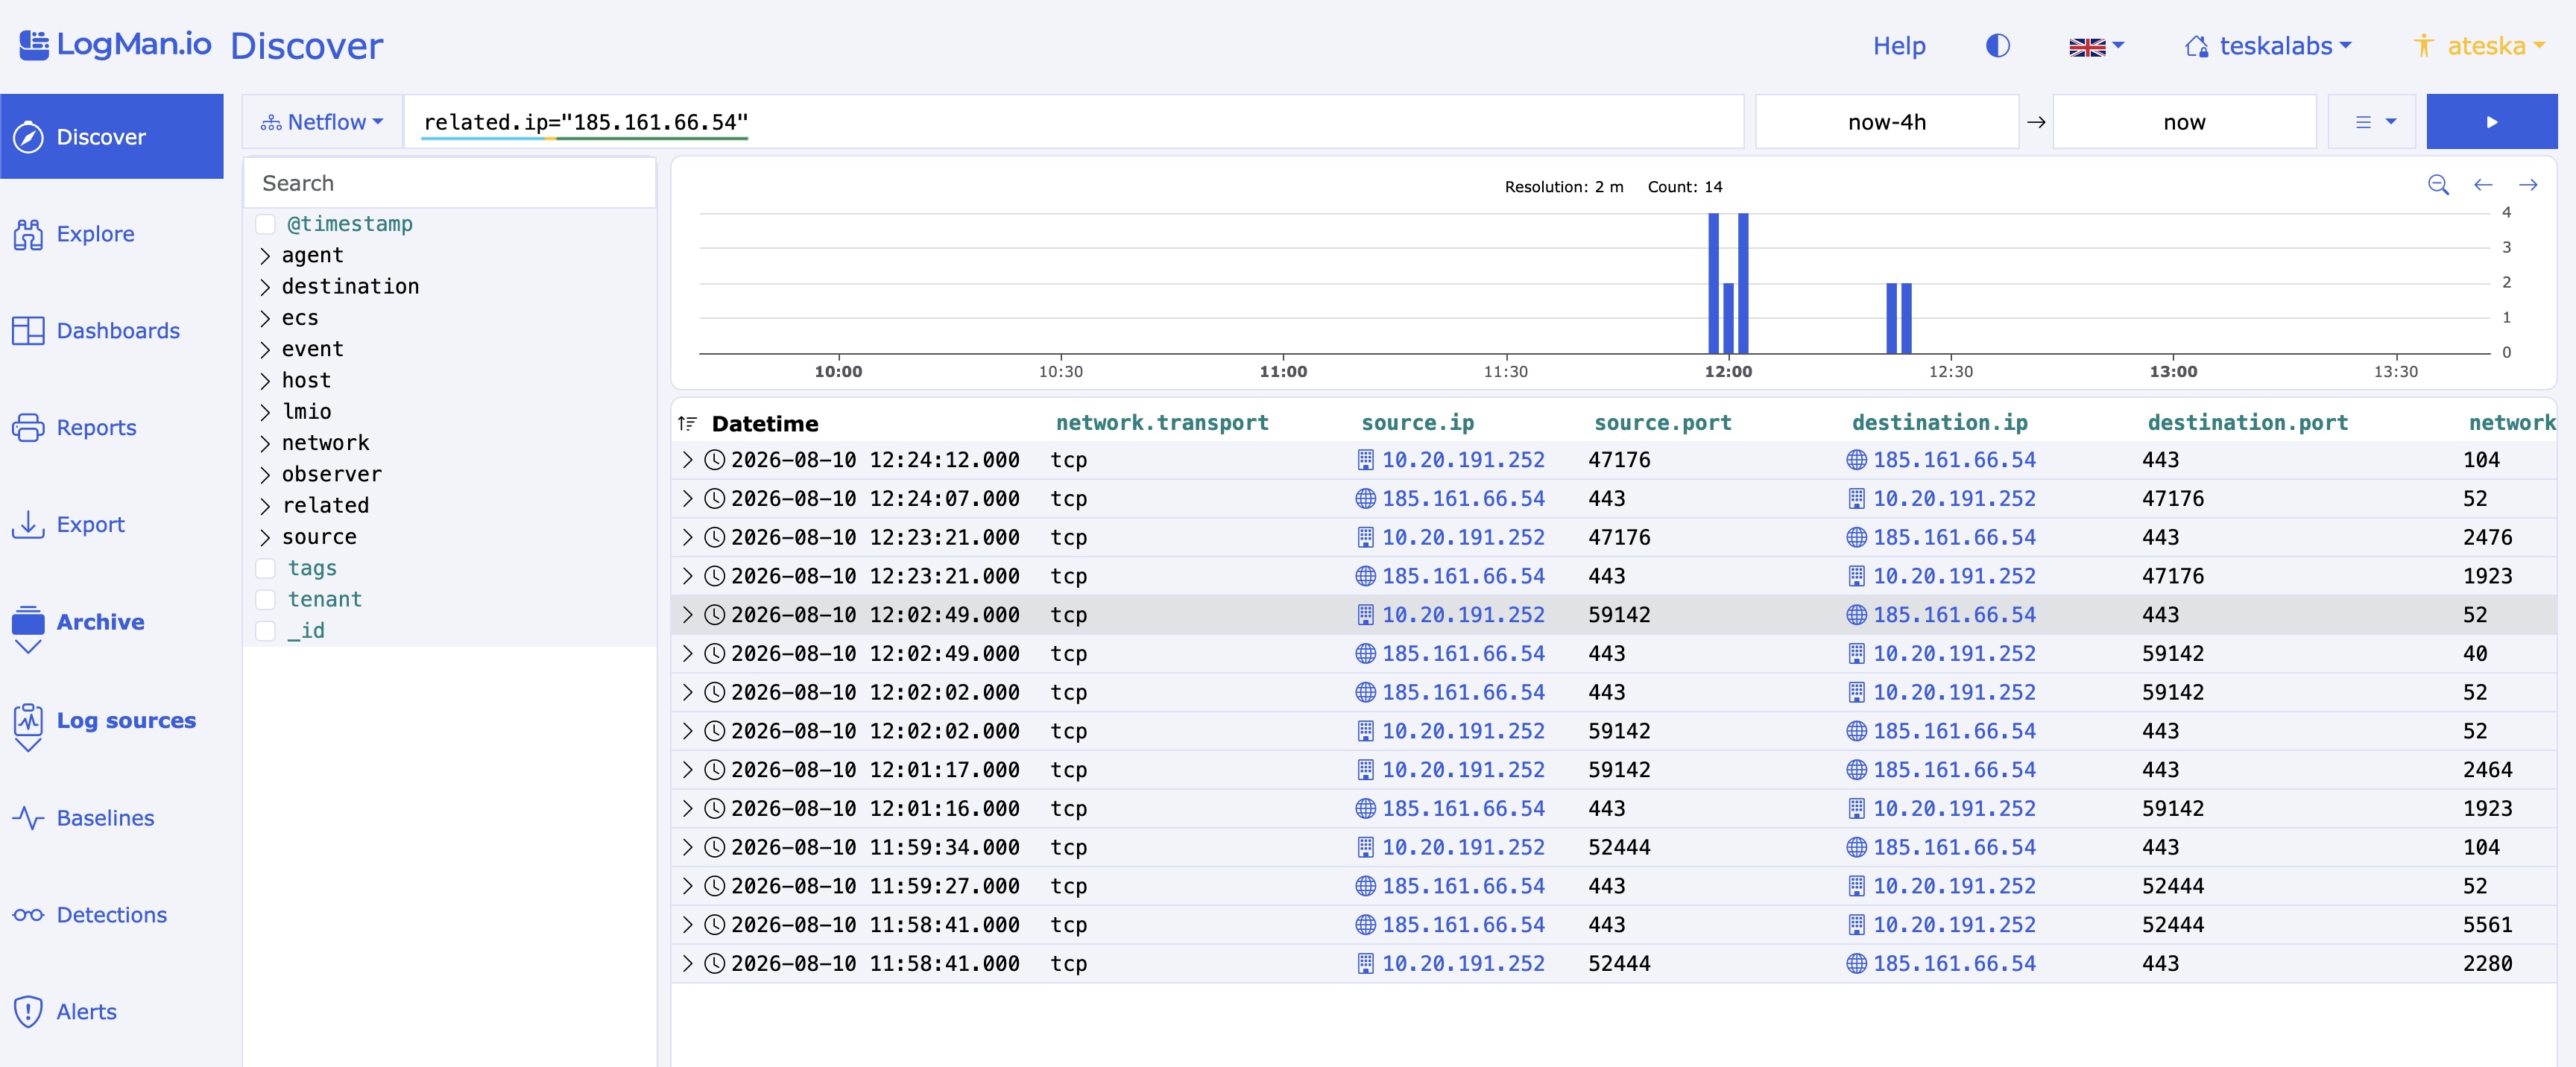
For example:
- All flows from or to a specific host:
related.ip:10.17.160.50 - Traffic to non-standard destination ports:
destination.port:4444 - A specific protocol:
network.transport:tcp
From there you can build Dashboards (top talkers, bytes per host, protocol breakdown, external communication), set up correlation rules in the Correlator (e.g. alert on a host exceeding a byte threshold to a given destination), or feed the records into Baseliner to learn what normal traffic looks like per host — exactly the kind of behavior-change detection where flow data shines.
Pivoting into other sources
You can easily pivot from the NetFlow records to other logs by switching the data source to Events, or to an even more specific one — for example to check what else a suspicious host has been doing.
Troubleshooting
| Symptom | Likely cause | Fix |
|---|---|---|
| No events in Filebeat log | UDM not exporting, or wrong collector IP/port | Check tcpdump -i any udp port 2055; confirm collector address/port 2055 in UniFi settings |
| UDP arrives but no flows decoded | Firewall/nftables on the collector host dropping UDP |
Allow inbound UDP/2055 from the UDM |
| Port published but netflow input not running | Container still running the old config | Recreate: docker compose up -d --force-recreate filebeat |
| Flows published but nothing in LogMan.io | Wrong collector address, TLS mismatch, or stream name mismatch | Verify output.logstash.hosts; check Collector logs on 5044; confirm the stream field matches the expected stream name |
| Decode errors after UDM reboot | Stale templates | detect_sequence_reset: true handles this; if problems persist, restart Filebeat |
More information
- Filebeat NetFlow input reference: Elastic documentation
- LogMan.io Collector — Beats, Logstash: Collecting from Beats or Logstash
- LogMan.io — Discover, Dashboards, Correlator: Analyst Manual
If you need help connecting your network gear to LogMan.io, contact TeskaLabs support at support@teskalabs.com.